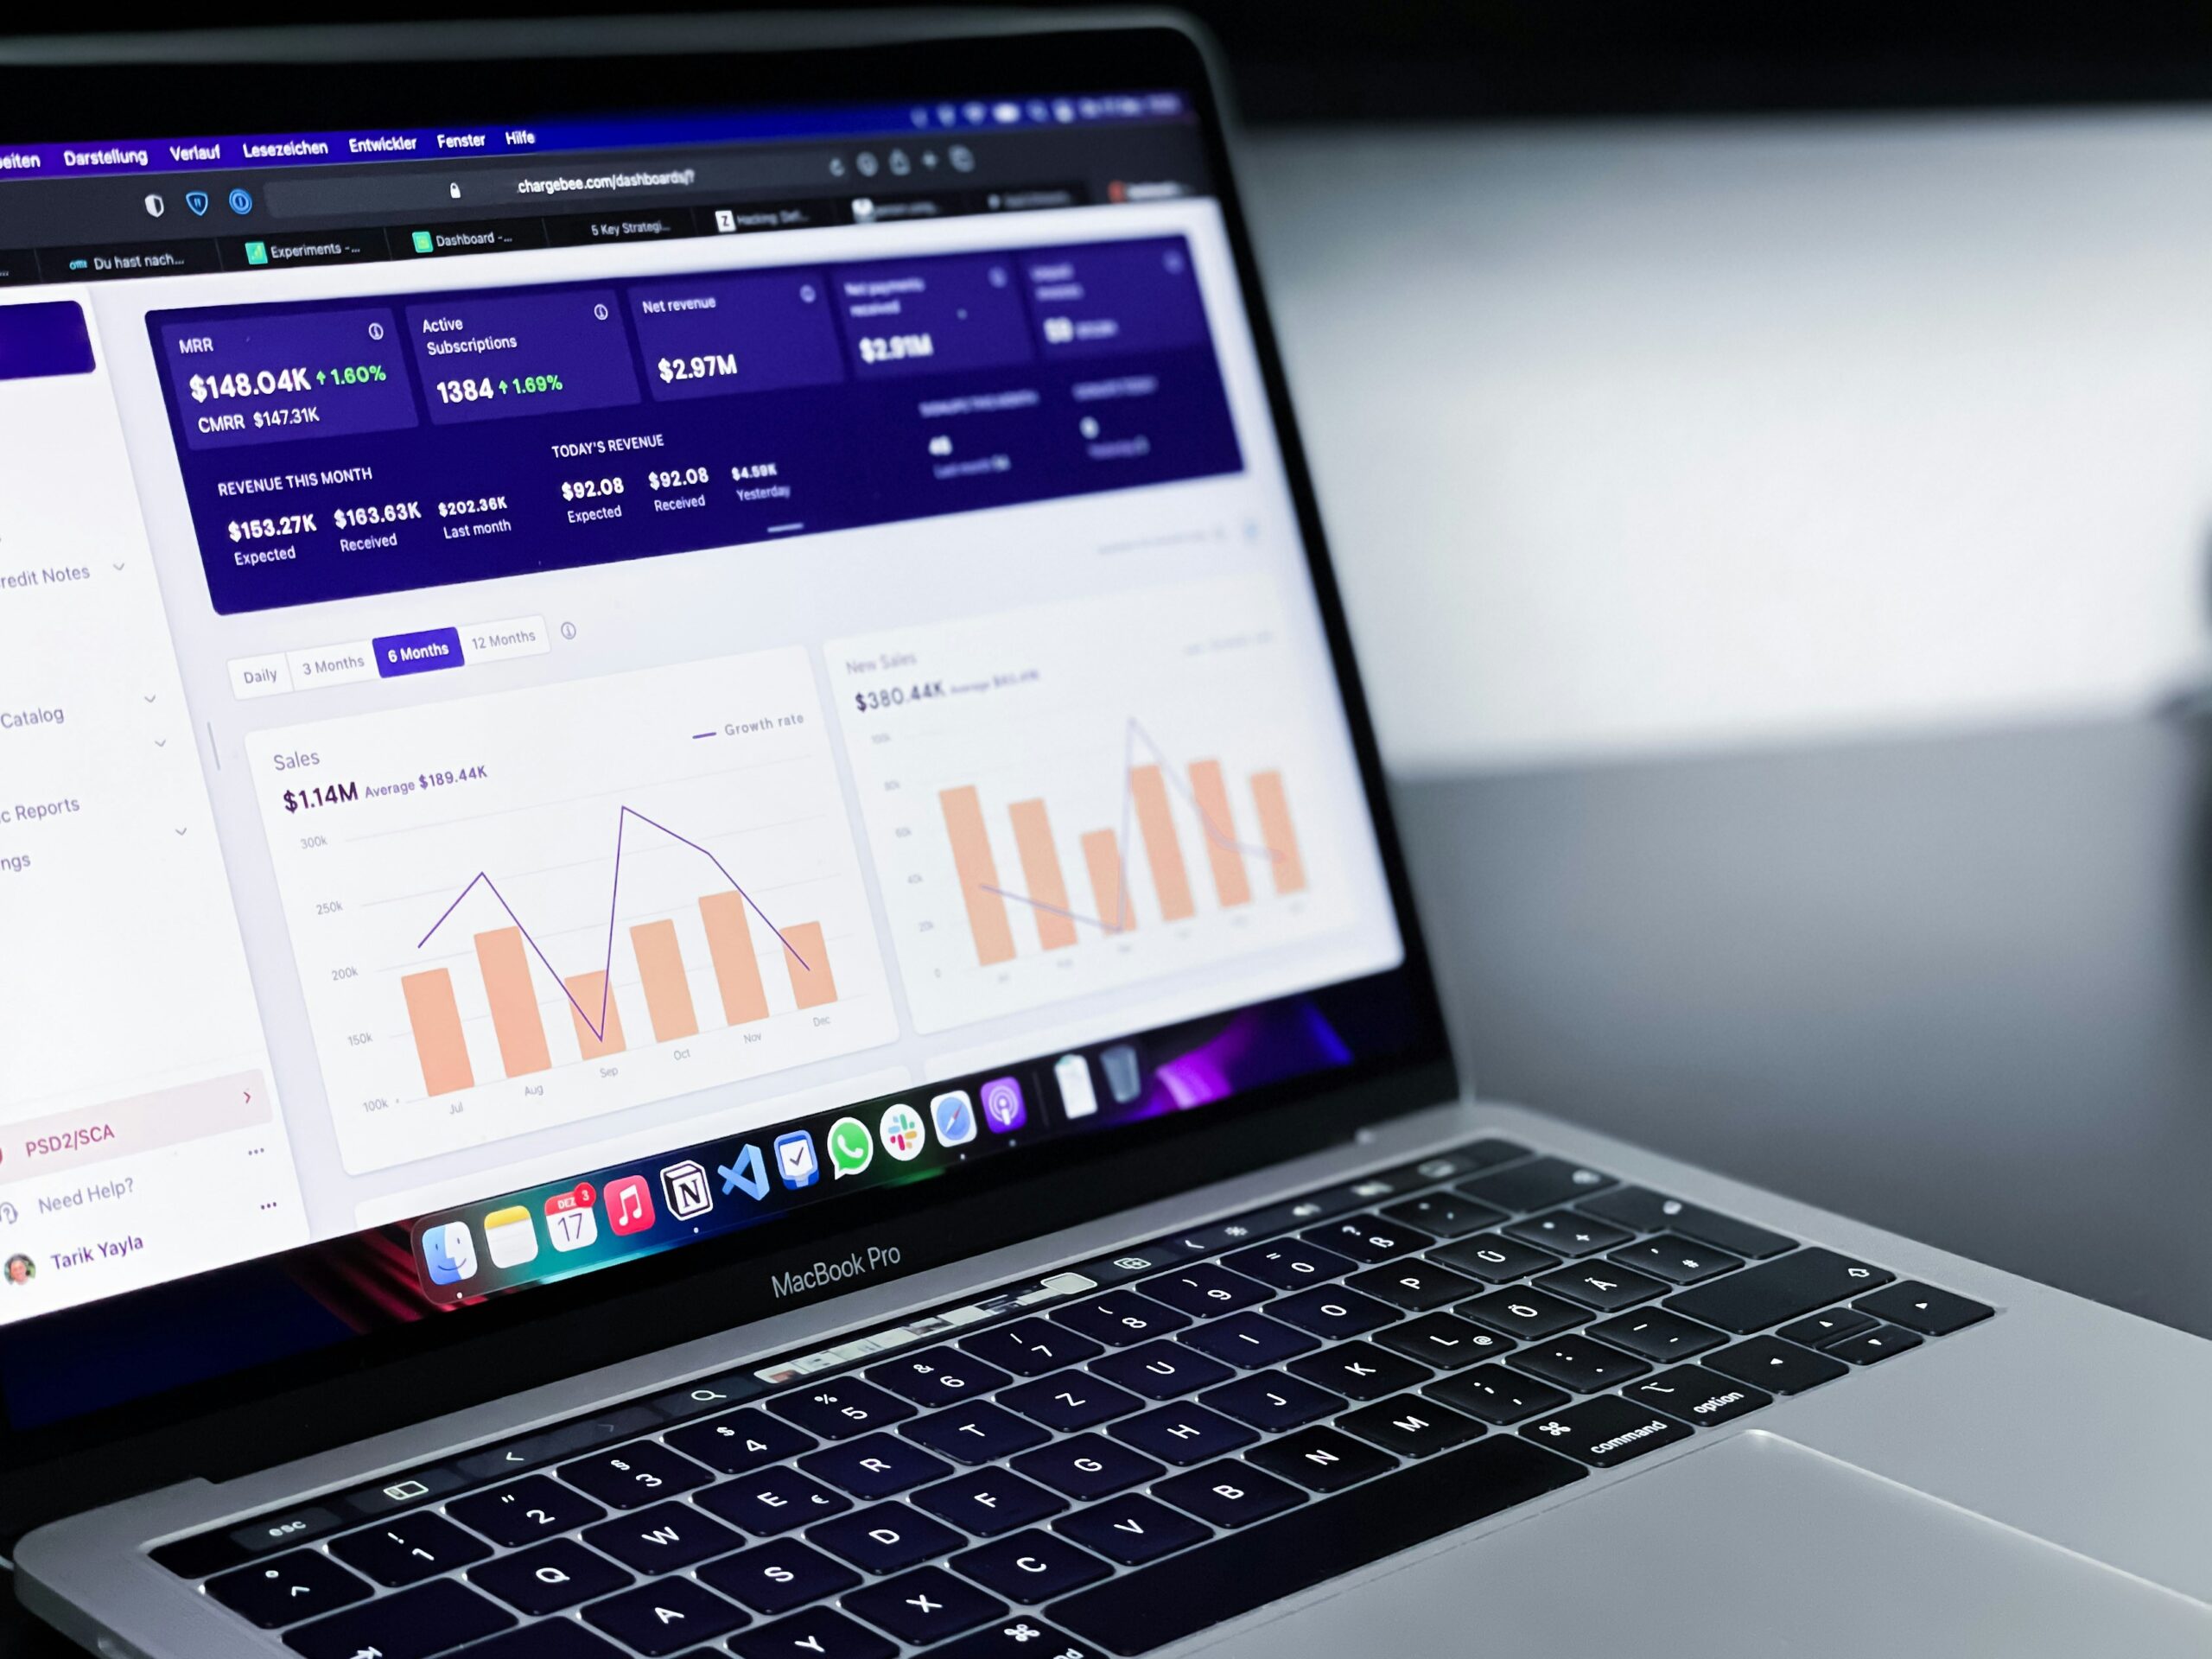
Marketing reporting and data visualization

Marketing reporting and data visualization play a crucial role in providing a deep understanding of the performance of actions implemented on the web. They enable strategic decision-making and optimize campaign performance.

Data visualization: Tailoring to customer preferences

Data visualization and reporting provide an overall view of the effectiveness of advertising campaigns. By identifying the most performing revenue sources and pinpointing less productive areas, it’s possible to allocate budgets more strategically. Metrics such as Return on Investment (ROI), conversion rates, and Key Performance Indicators (KPIs) are presented in a clear and concise manner, facilitating decision-making.

Get a free estimate

The benefits of data visualization

Reporting highlights key metrics such as conversion rates, return on investment, web traffic, and social media interactions. This allows for an understanding of the effectiveness of campaigns.

Through in-depth data analysis on dashboards, the Fidelitix team can adjust strategies and optimize campaigns proactively.

Data transforms complex information into charts, interactive dashboards, and visual reports, making communication with internal and external stakeholders easier.

The impact of visualization on marketing strategies

Marketing reporting and data visualization transform raw data into actionable insights, firstly contributing to optimizing marketing investments. By identifying the best revenue sources, businesses strategically optimize their budgets.

In-depth data analysis reveals high-potential market segments. By understanding customer behavior, we tailor campaigns to their specific needs to create more targeted campaigns. Combine in-depth analysis and visualization to optimize strategies, performances, and marketing objectives. The future relies on data intelligence.

Data visualization tracking and management tools

Our tracking tools are designed to provide you with a clear and comprehensive view of your data, making it easier to make decisions. We implement a variety of dynamic visualizations, such as charts and maps, to make data understandable at a glance. We centralize campaign data by integrating multiple sources.

Transform your raw information into meaningful visualizations. Simplify the understanding of trends, opportunities, and challenges, and make informed decisions to propel your business to success.

Discover our tools

Do you have any questions? Contact us today.